
Reports → Equipment Cost Analysis lists every unit across all your customers, ranked by lifetime billed repair spend. Use it to find the units that keep costing money, which are your best replacement leads.
Who can see it
Anyone with access to Reports. By default that's owners and admins.
Open the report
Go to Reports in the sidebar and click Equipment Cost Analysis.
The top of the report
| Widget | What it shows |
|---|---|
| Lifetime repair spend | Total billed spend on the units you're viewing, the number of units and repairs, and the average per unit. Also a By equipment type breakdown, plus a list of types with no repair spend. |
| Repairs | Billed repair invoices across those units, with the average per unit. |
| Per unit | Average lifetime spend per unit. With inventory tracking on, this becomes Margin (billed spend minus the cost of parts used). |
| Never serviced | Units with no billed service on record. |
| Where the money pit is | A grid of spend by equipment type and time since last service (Never, <30d, 30–90d, 90d–1y, >1y). Dark cells on the right are old equipment that keeps eating repair money. |
Every widget updates with the filters below it.
Filtering
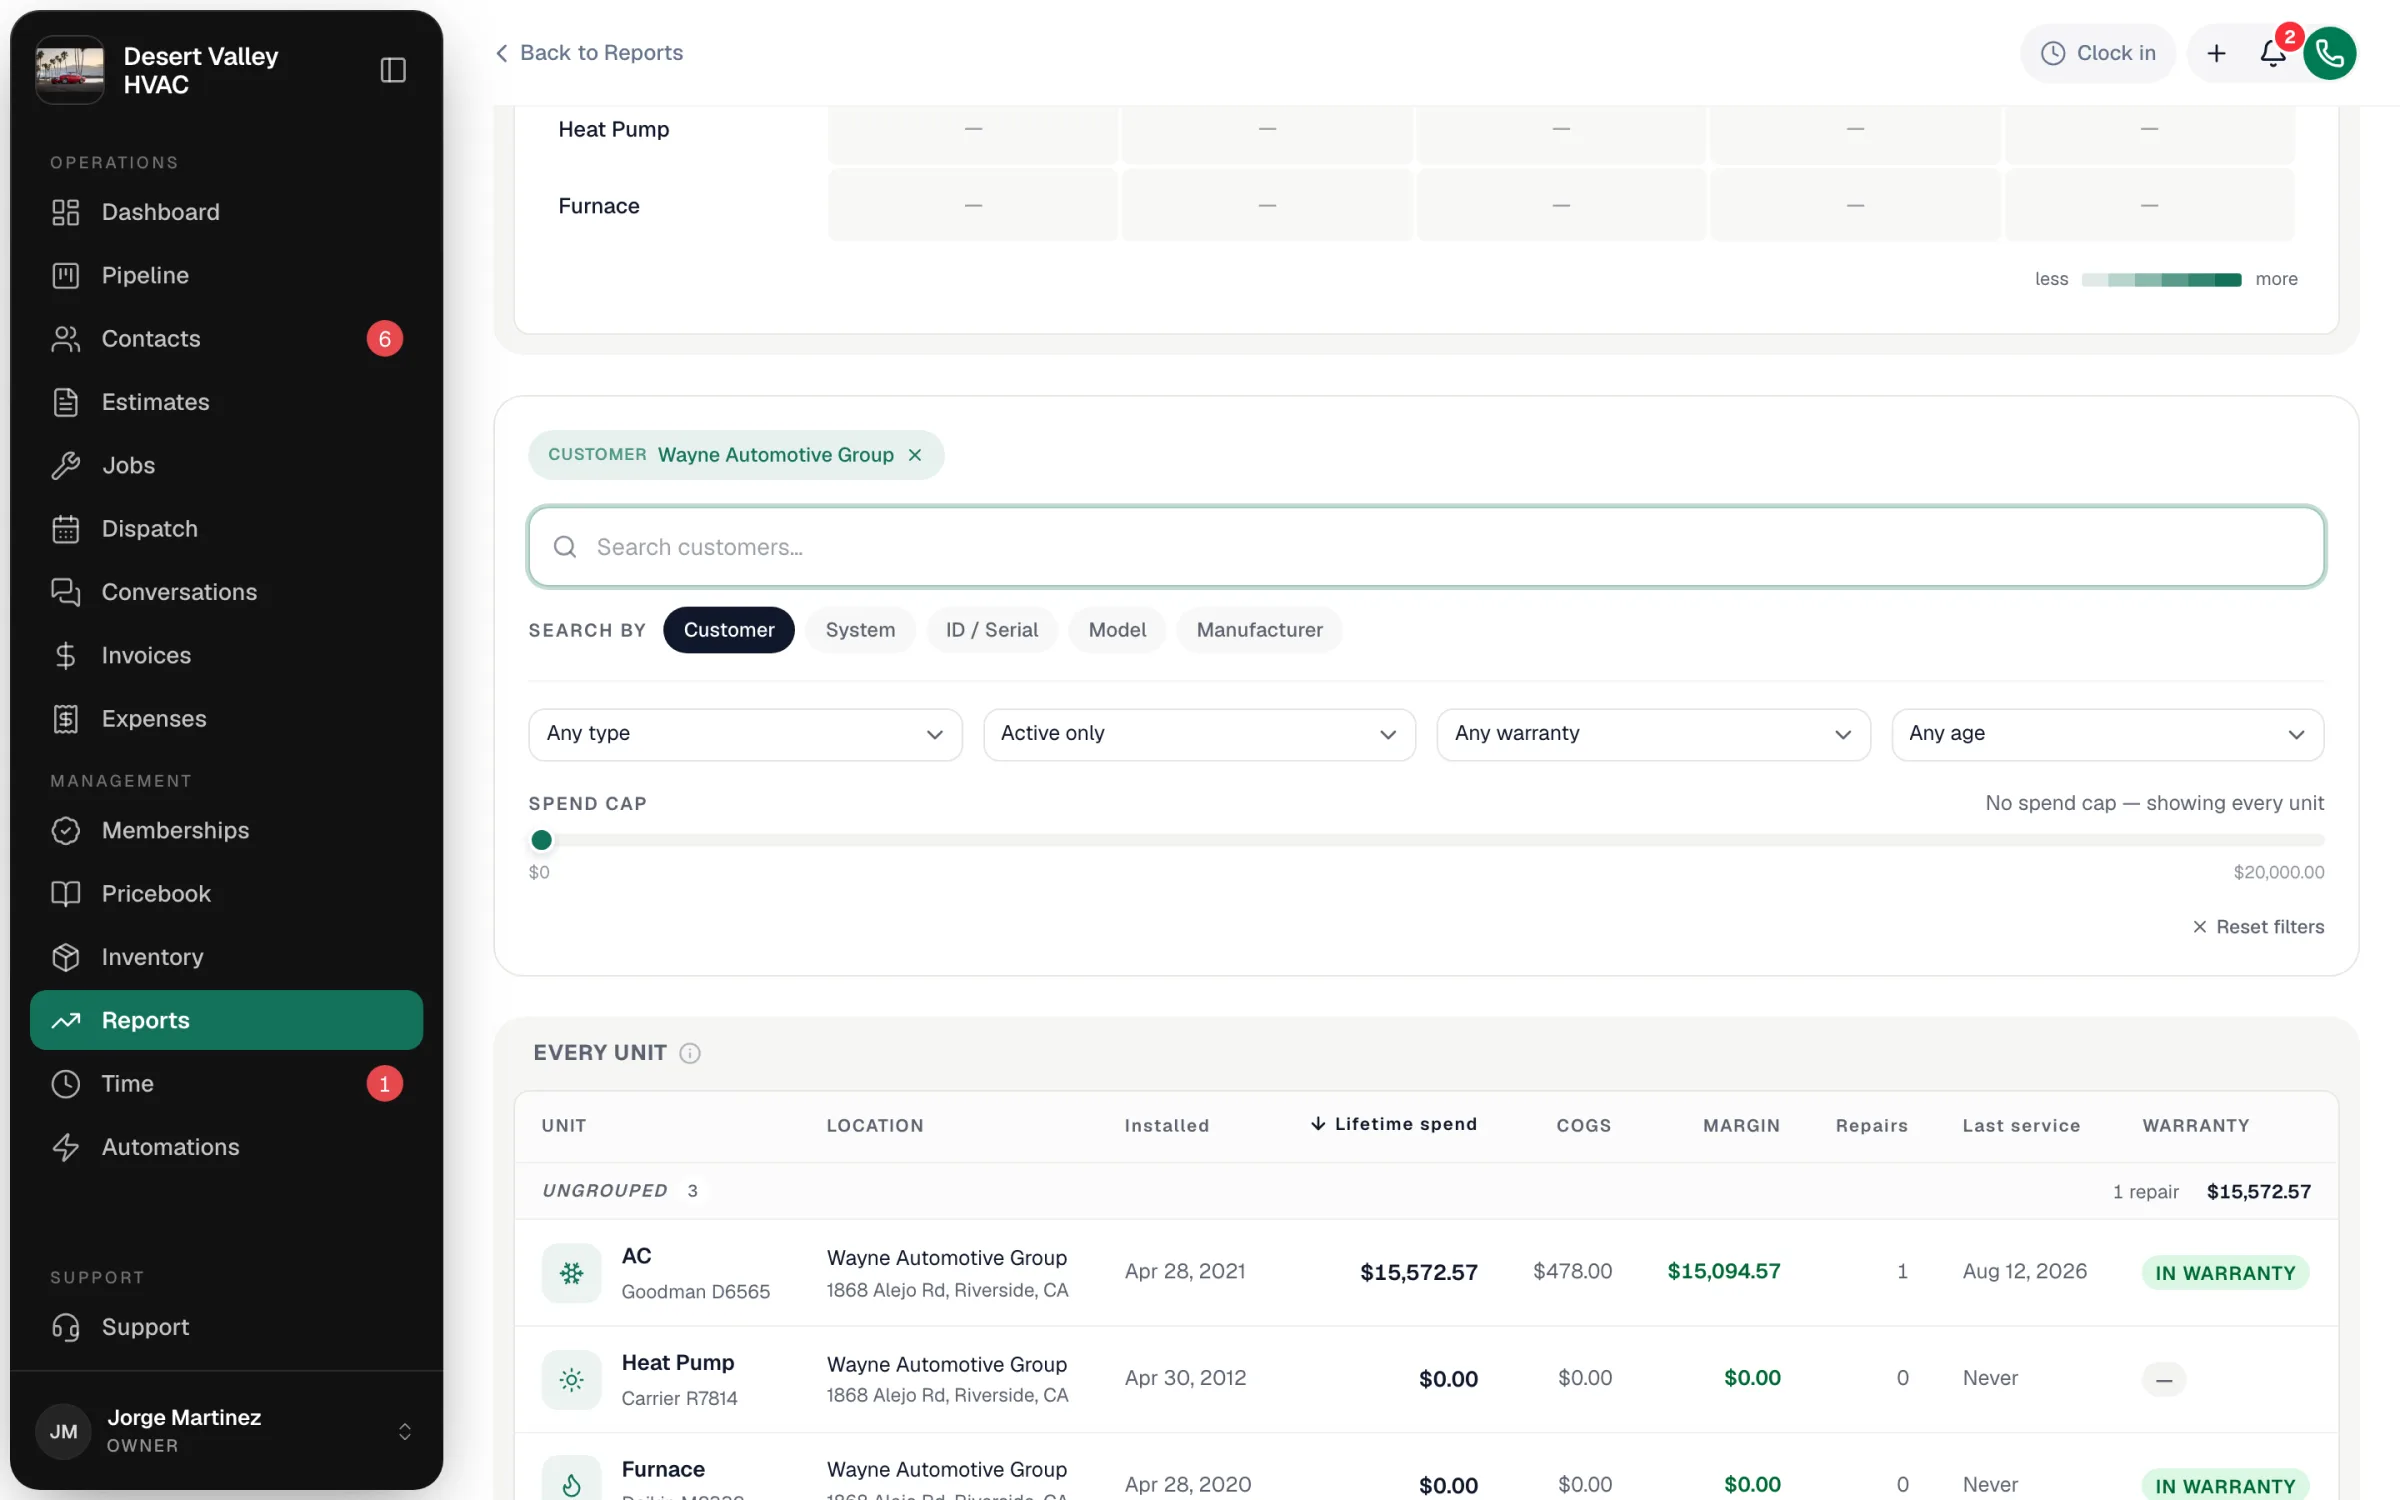
Search by decides what the search box looks for:
| Search by | How it works |
|---|---|
| Customer / System | Type a few letters and pick from the list. It becomes a filter chip you can remove with ×. |
| ID / Serial | Matches asset IDs and serial numbers as you type. |
| Model / Manufacturer | Matches as you type. |
Next to the search box:
| Filter | Options |
|---|---|
| Equipment type | Any type or one category: HVAC, Refrigeration, Plumbing, Electrical, Other. |
| Active or retired | Active only (default), Retired only, Active + retired. |
| Warranty | Any warranty, In warranty, Out of warranty, No warranty date. |
| Equipment age | Any age, Never serviced, Serviced <30 days, Serviced <90 days, Serviced <1 year, Serviced >1 year. |
| Spend cap | A slider that hides units billed more than the amount you pick. Use it to look at the lower-spend units without the few expensive ones taking over. Clear removes the cap. |
Reset filters puts everything back.
The Every unit table
One row per unit, grouped by system, with Unit, Location (customer and address), Installed, Lifetime spend, Repairs, Last service and Warranty. When inventory tracking is on, COGS and Margin columns are added. System-wide charges get their own rows marked System-wide.
It's sorted by lifetime spend, highest first. Click Installed, Lifetime spend, Repairs or Last service to sort by that column instead. Click a unit to open its page, or a system to open the system.
Exporting
Export CSV (top right) downloads what you're viewing, with your filters applied: asset ID, type, manufacturer, model, serial, customer, property, system, install date, warranty expiry, status, lifetime spend, repairs and last service. COGS and margin are included when inventory tracking is on.
Ways to use it
- Build a replacement list: set Warranty to Out of warranty. The top of the list is your next round of install work. Open a unit and print its history to show the customer.
- Review one account: search a customer before a renewal or walkthrough and start with their most expensive units.
- Handle recalls: search by model or manufacturer to find every affected unit you service.
- Check warranty work: set Warranty to In warranty. High billed spend on units still under warranty is worth a second look.
With inventory tracking on, an item's Usage history button in Inventory opens this report showing only units that used that part. A banner names the part, and Clear filter returns to the full list.