
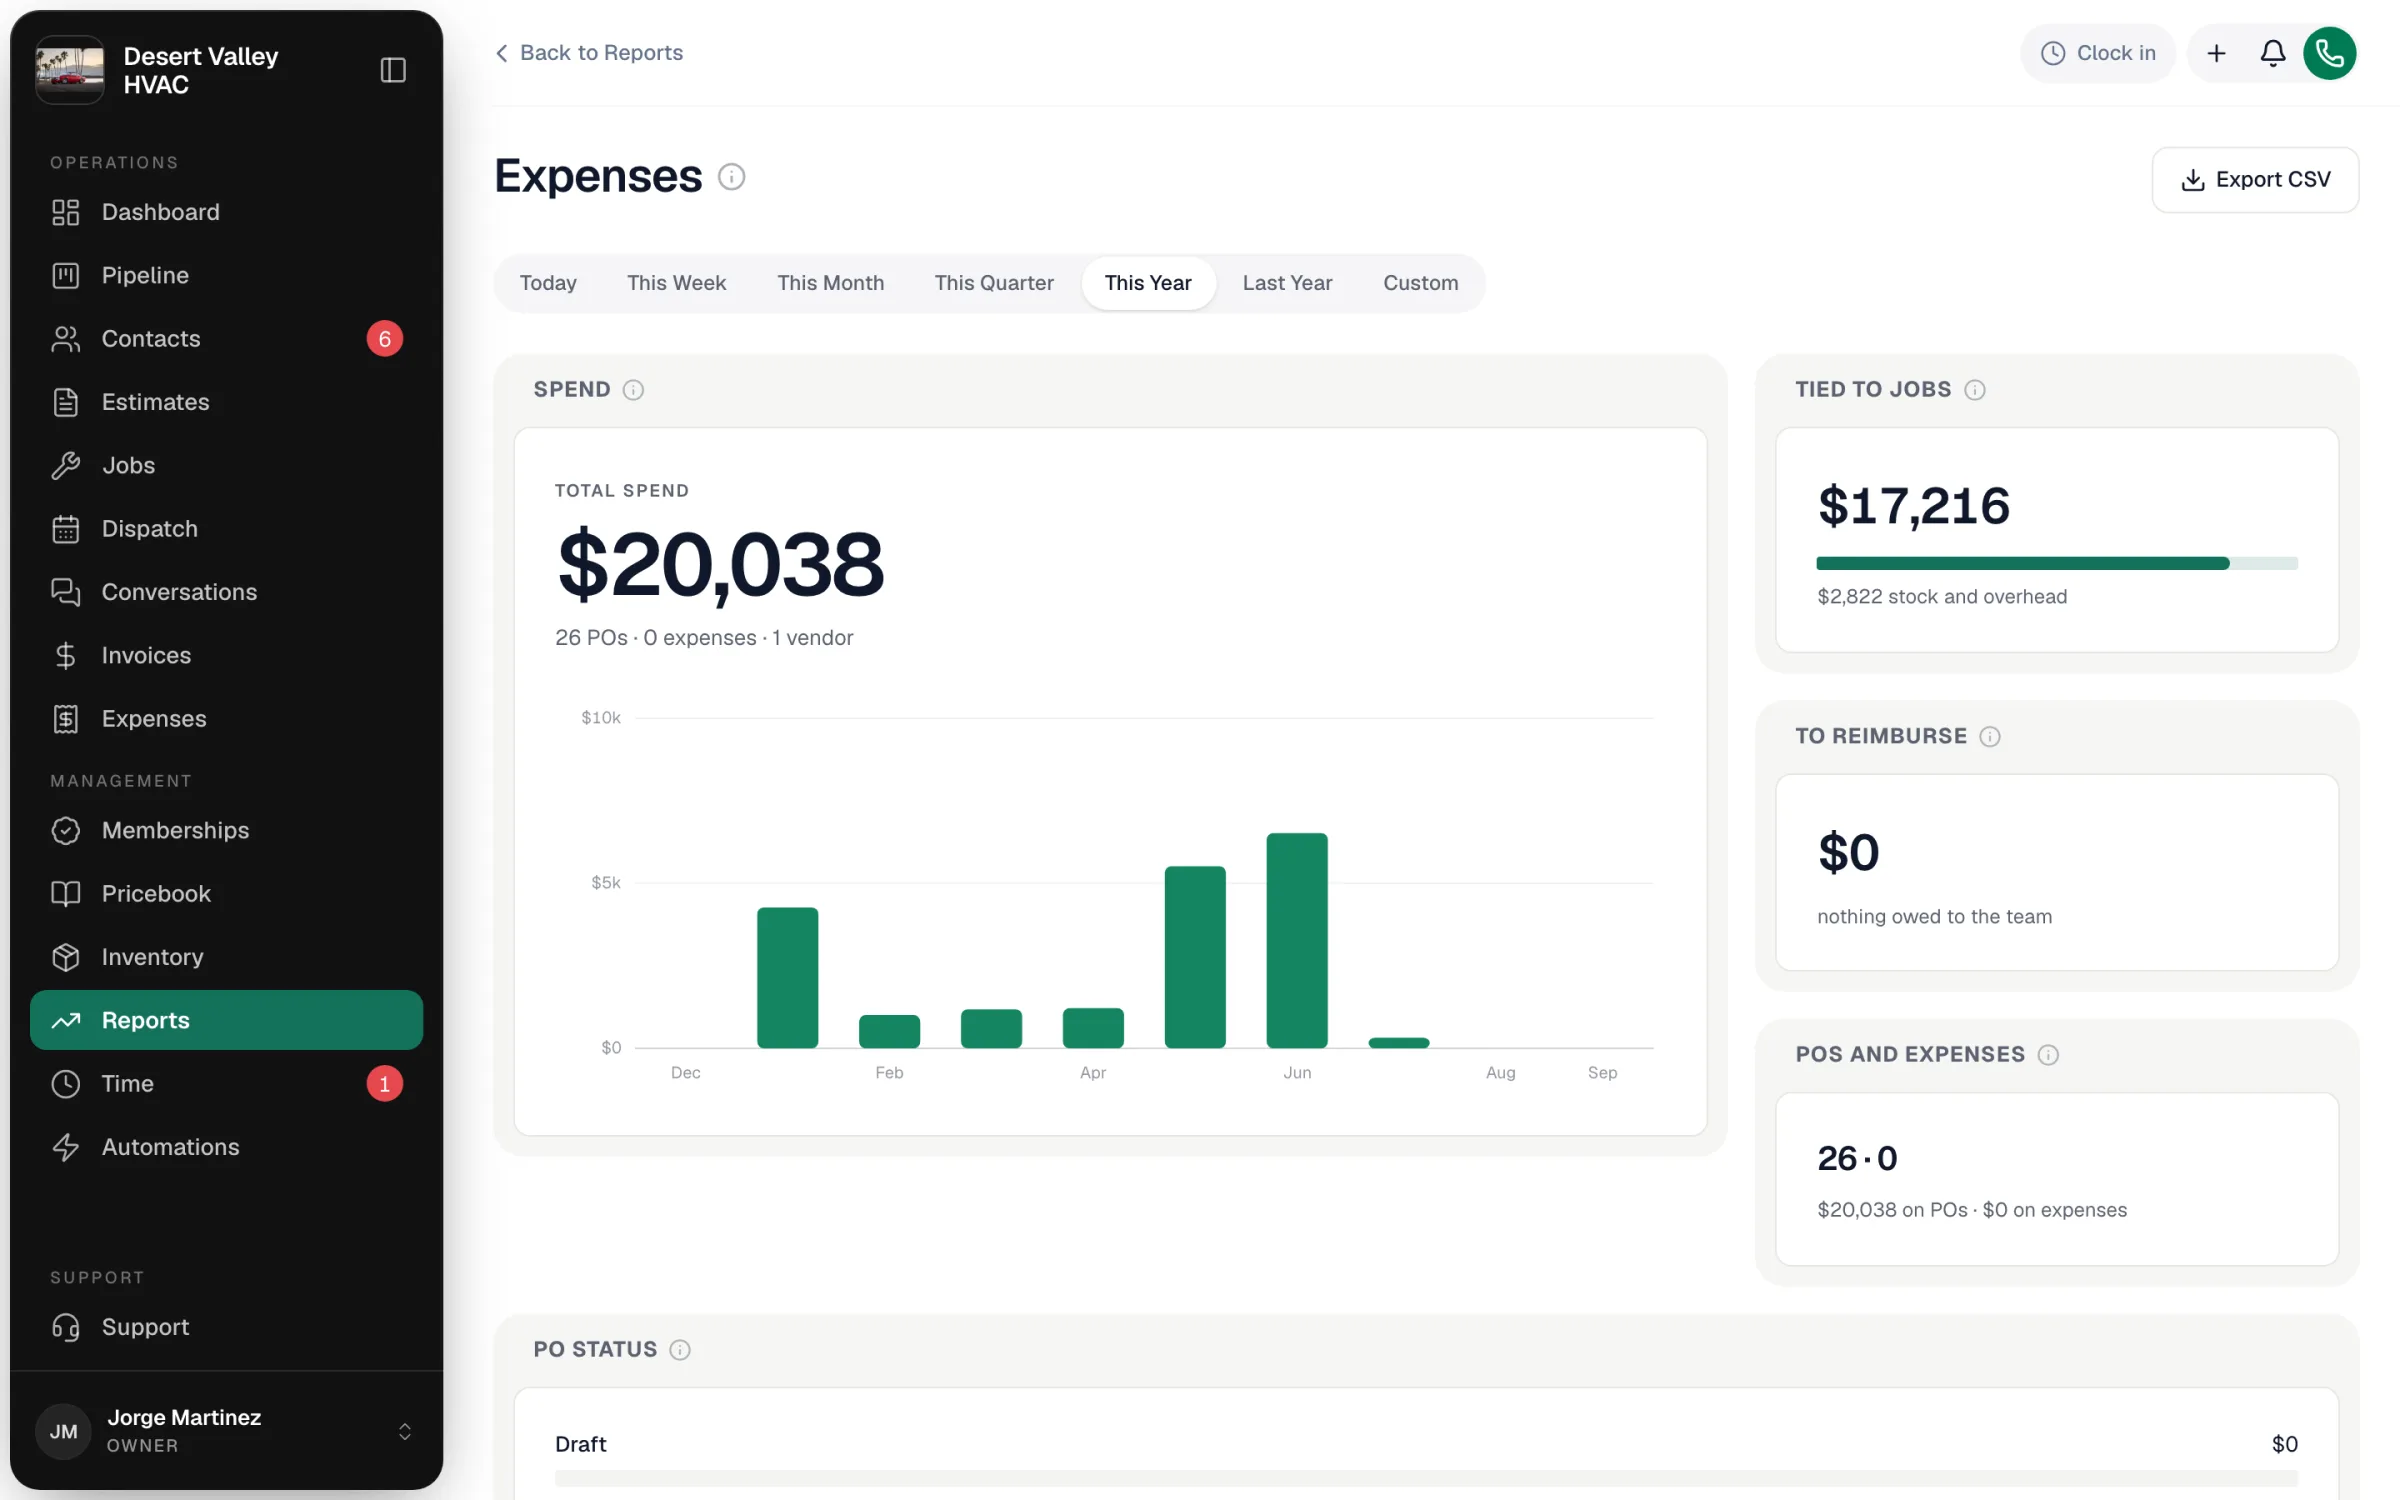
The Expenses report shows what's going out the door — purchase orders and the expenses your team logs — by category, by vendor, and how much of it is tied to jobs versus overhead and truck stock.
Open it from Reports → Money → Expenses. Owners and admins can see it.
What's counted
| Included | Left out |
|---|---|
| Purchase orders created in the range, in any status except Cancelled. Each PO counts at its cost. | Cancelled POs. |
| Expenses dated in the range (the expense date on the receipt), in any status except Rejected — drafts and submitted expenses count too. | Rejected expenses. |
Pick the range with the buttons at the top (Today through Last Year, or Custom).
The tiles
| Tile | What it shows |
|---|---|
| Spend | Total spend (POs + expenses) in the range, with a chart of spend per day, week or month. |
| Tied to jobs | Spend attached to a specific job, against truck stock, overhead and one-off purchases that aren't. |
| To reimburse | Expenses paid Personal (reimburse) that the office hasn't marked reimbursed yet. |
| POs and expenses | How many of each, and how much was spent on each. |
| PO status | PO spend by where each purchase order sits — draft, ordered, received or billed. Billed is confirmed actual cost. |
| Expenses by category | Logged expenses grouped by category (top 8). Purchase orders don't have a category, so they aren't in this list. |
| By category over time | Each period's spend split by category, with purchase orders as their own segment. |
| Top vendors | Your biggest suppliers by total spend (top 8) and each one's share. Expenses without a linked vendor use the merchant name from the receipt. |
Export
Export CSV downloads the totals, spend over time by category, PO status, expense categories and vendors.
Good to know
- Job costs. Purchase orders and expenses attached to a job also flow into that job's cost on the Job Profitability report.
- QuickBooks. Billed purchase orders can sync to QuickBooks as Bills, and expenses as Purchases — see Syncing purchase orders and Syncing expenses.